Eventually, I even created an Expert Advisor in MetaStock, to help with ERRC placement. It highlights the candles (I always use Candlesticks) in my chart different colors based on the relative OS/OB extremes. This helped me more rapidly and conveniently find the most effective dates to use for my SD and ED positions.
At the end of my article, I offered a free copy of my Expert Advisor, which I call the McKinnon ERRC Color-Coder, to the readers. I am no longer offering this Expert for free, <
Here's an illustration of the <

Below, we zoom-out a bit to show how this ERRC did at predicting the price movement, and to show the eventual break-out from the ERRC, indicating the trend has ended.

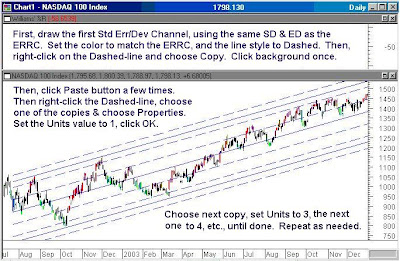
OK, we've got our accurate ERRC, now we add the Standard Error/Deviation Channels, to turn this into a TeamWork Channel. I use a Long-Dash line style for Standard Error Channels (Std Err Channels), and the Long-Dash-Short-Dash line style for the Standard Deviation Channels (Std Dev Channels). The ERRC is always a Solid-Line style. <>
Std Dev Channels can often fall on top of, or very near some of the Std Err Channels. Only draw those lines that do something useful in the chart. All these lines can make for a very busy chart, so use as few as you can to meet your need.

Note the one Std Err Channel I've placed just outside the ERRC's outer lines. I will almost always draw a line at this position to act as a Fenceline Channel. It helps me determine whether an attempted break-out from the ERRC is 'tentative' or 'actual'.
Once you've placed enough stacked channel lines to meet your needs, detach the McKinnon ERRC Color Coder Expert Advisor from the chart. The candles will revert to black (assuming that is your 'base' color), making them more visible amid the channel lines.
Summation: I hope these instructions and illustrations are sufficient to give you some level of confidence, so you can begin trying out the ERRC and TeamWork Channels. The McKinnon ERRC Color Coder Expert Advisor could be very helpful to you, if you're serious about learning these methods. If this multiple channel drawing process seems tedious, please don't let you dissuade from trying it, as I believe the ERRC and TW Channels can be very valuable to you. Hopefully, in the future MetaStock will have tools to make it easier.
Wouldn't it be nice if Equis <
JUMP TO MY NEXT POST
===========================================
No comments:
Post a Comment