This is to let you know that I am closing my Blogs.
This notice will run until August 1, 2019, then I will remove it and close my Blogger account.
Sunday, July 7, 2019
Friday, January 19, 2018
Starting Anew on 1/19/2018
I finally seem to have access to my blog, after some time without it!
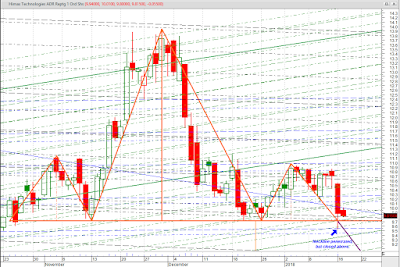
I hope to give you some new info worth reading. To start, I'd like to post a chart of HIMX, in a Head and Shoulders formation, with Neckline Penetration imminent. This is the chart as of yesterday, 1/18/2018. I will give you more information, as I can get to it, but I am watching today's 5-Minute chart of HIMX on Yahoo Finance, and seeing the potential for the final penetration of the Neckline today. If not it should be early next week.
(Click on the chart to see an enlarged image.)

Thursday, October 12, 2017
HIMX Flag Pattern
Channel Challenges for Technical Analysts - 10/12/2017
It has been a long time since I worked on this. Losing ones job, taking away funds, means, no MetaStock, so I had been unable to generate any new posts about my charting methods, TeamWork Channels. Here are my to latest charts. They are both of HIMAX (HIMX), and reflect two views of the same thing. I had thought that HIMX was in a Pennant pattern, but it failed, but looking again at the chart, I became aware that was actually forming a FLAG pattern. Here are my two charts on HIMX, indicating that sometime soon, possibly as early as Monday, the prices will hit the Flag Bottom, and begin to rise to the top of the Flag. At that point, perhaps a couple weeks out, it should penetrate to new highs, once the Flag pattern is completed. I recommend buying as soon as you see the prices touch the bottom of the Flag.
I currently own a whopping 8 shares of HIMX, and early in January 2017, I realized the Ford shares (F) I had bought for him were going nowhere, so able some research, I determined that HIMAX was likely the small company that Apple had selected to provide a critical new 3D and intelligence chip needed for their new iPhone, which is due out before the end of this year. If I can come up with some more money, I intend to buy as much of HIMX as I can. This Flag Pattern should make it worth every penny I can find!
If you have read my old posts, you should be aware of how my TeamWork Channels work, and how to place them on your charts, but if not, please free to ask questions. I'd love to help you learn this method of mine. As before, click on the chart image to enlarge either or both of them.


Tuesday, November 11, 2014
New Posts: 004 - Enhancements to My Proposed TW-Channel Tool
As promised, I have listed more things I believe the proposed TW-Channel Tool should do to make this channel easier to use and enhance its capabilities. I've done so, by editing my original proposal post, adding more ideas, and making the text a bit more readable, too. Please click on this link to my old Post 011 "WANTED: A TeamWork Channel Tool!" to see what I'd like to add to it. I highly recommend you watch Post 011, as I may update it more in the future.
You know, I really should have made the title of that post "NEEDED!!: A TeamWork Channel Tool!" Hopefully, with the number of people reading my blog growing steadily, I'll be able to get input from others to better define the NEED for this tool!
You know, I really should have made the title of that post "NEEDED!!: A TeamWork Channel Tool!" Hopefully, with the number of people reading my blog growing steadily, I'll be able to get input from others to better define the NEED for this tool!
Sunday, November 9, 2014
New Posts: 003 - Why I Believe Day Traders Can Use TW-Channels
First, let me make THREE things clear:
1. I have never attempted to day-trade, even though in the past I have had occasion to use MetaStock Pro, which tracks the markets live in any level of trading chart you want. You can trade "tick", 1-minute, 5-minute, 10-min, etc., or go with Daily, Monthly, whatever. You can do a mixture of multiple time frames, if you wish.
2. Although I fully believe that TW-Channels should be implemented in the End-of-Day version of MetaStock, and in MetaStock Pro as well, I cannot say whether it would be a good idea to actually plot TW-Channels in day-trading time interval charts, such as "tick", 1-minute, 5-minute, and the like. Certainly they would be useful in Daily, Weekly, Monthly charts, but I've never had a chance to try using them in any time-interval less than Daily.
3. I have, however, watched 1-minute and 5-minute chart prices react to the Support/Resistance price-levels in my Daily charts having well-drawn TW-Channels in them. I'm certain that with well-drawn TW-Channels in a Daily chart, any day-trader could strengthen his/her trading with regard to using Support/Resistance levels to make trading decisions. Assuming, of course, that the Day Trader is willing to try it long enough to see it work.
The trouble with doing this now, though, is the tedium and time needed to place valid TW-Channels in a Daily chart of the targeted trading instrument. In order for TW-Channels to be as useful as they could be, a new tool is needed,...
the TW-Channel Tool that I've proposed for MetaStock.
the TW-Channel Tool that I've proposed for MetaStock.
The illustration below is a crude one, but it will serve to show how TW-Channel Daily charts could help the day-trader see Support/Resistance areas before they are actually hit:
On the left you see an image of the candlestick that appeared on my Daily chart, with lines crossing it at various angles and prices. On the right is an OHLC Bar of the same date's price movement. Note the purplish and reddish Std-Err Channel Lines that draw a flat sort of X across the candle and the bar. Also note that the mid-point of the X is just to the right of the mid-point of the candle and just to the right of the OHLC Bars vertical line.
 |
| Candlestick on Daily Chart of GM on 11/07/14 |
 |
| OHLC Bar on Daily Chart of GM on 11/07/14 |
 |
| Two screen-shots of Google's 1D chart of GM for 11/07/2014. |
If you are a day-trader, can you not picture yourself being able to use the extra "intelligence" that these lines provide to help you make a trading decision?
Tuesday, November 4, 2014
New Posts: 002 - NEW!!! My TEAMWORK CHANNELS(tm) Plug-In PROPOSAL!
Updated New Post 004 --- My Proposed TEAMWORK CHANNELS TOOL plug-in !!!
In early April this year, I met with Jeff Gibby at MetaStock's office to show him my PowerPoint Presentation about the new TeamWork Channels Tool. He was impressed and asked me for some details, and, how much I'd like to charge for the Plug-in! He said that the programming team was fully booked getting the newest version of MetaStock ready for release in May. He said that after the release, we would get together to begin developing my plug-in. Meanwhile, I am working on an instruction manual and a curriculum for a training class to introduce my Plug-in.
In early May, my wife and I took a two-week trip to Hong Kong. We stayed with her older sister and met other relatives in Hong Kong. We had planned to visit Xiamen, China, where my wife was born. Sadly, because of Roxana new US Citizen status, China's representatives said China could not give her a visa. She would have to get it from the US Government because she is now a US Citizen. She must get it from the US Government, they insisted. Unfortunately, the US Embassy in Hong Kong was closed. Roxana was very upset, but we will try again next year.
The trip was not wasted, though. We had a good couple of weeks visiting my wife's older sister, and her cousins, etc. Her nephew, Michael, drove us all over Hong Kong, showing us the sights, etc. He is a brave and skilled driver, and that is a VERY good thing, or I might not be typing this right now. Hong Kong is an amazing place, but the TRAFFIC is horrendous! Thankfully, Hong Kong is VERY SERIOUS about making people learn to drive well, and I'm grateful for that! We returned home safely, hauling my wife's many gift items, and sadly, a Major Case of JET LAG!
After our return, Jeff contacted me to let me know that as he was going to Sales trip to Europe for the latest release of MetaStock. He would be back in late May or Early June. We planned to meet in June to begin the development of my plug-in. The tentative retail price currently is $299.00, but that could change once development-costs are considered.
As soon as I can, I plan to update my PowerPoint Presentation, after Jeff and I have discussed the details of the development, and perhaps I'll be able to post a copy of it here, along exactly what the price might be. As the details of development and programming are not known, as yet, we cannot give you a specific time that it might become available. But, we will announce it, and its purchase cost, as soon as we can. Hopefully, that will be before the end of July this year.
Meanwhile, watch this BLOG for announcements, please. I would welcome your feedback and emails, although I may need to defer specifics until later. I promise to keep you updated as soon and as often as I can. I hope to be able to offer a discount for readers of my blog, especially if you'll pass the word around about my plug-in becoming available.
Robert B. McKinnon
TeamWork Channels(tm) Creator
Sunday, October 19, 2014
New Posts: 001 - FINALLY!
CHANNEL CHALLENGES for
TECHNICAL ANALYSTS
is
REBORN AGAIN at last!!
I sometimes thought I might never be in a position to begin this blog again, but now, ready or not, I must relaunch it! A recent car accident wherein I or my wife could have been seriously injured convinced me I should not wait any longer.
I am starting with what I consider to be inadequate preparation, so please forgive me if you find this blog somewhat clumsy and uncoordinated. Please forgive me if my grammar and spelling are not quite right, too. I will try to edit and correct as needed, including errors I may discover in my old posts.
Click on each chart image to view enlarged in a new window.
General Motors (GM)
 |
| General Motors, showing DCB pattern, with some commentary. |
You can see my "paper" Short position started in the chart at the left. I decided I would Short 1000 paper-shares of the stock. (I currently have no real-world funds to apply to trading, so paper-trading is all I can do for now.)
 |
| Did not close outside FenceLine |
 |
| Will GM drop this far? |
I needed to estimate how far GM might drop, if the pattern were to continue developing. I measured the distance from the peak (where the red-line starts in my chart at the left), to the bottom-line of the ERRC. I plotted this distance in the chart at the right with the orange line that drops well below the current prices, showing a Short position would have some good potential. If my drop estimate is accurate, it could fall to $28.00, but could take a week or two to do so.

How My Short Position Has Gone So Far
As of 10/17/2014, my "raw profits" from this short position (in paper-shares) on GM are quite encouraging. See my spreadsheet charts at the right.
This does not mean that charts using ERRCs and TW-Channels will always go your way, but I find them very helpful when support and resistance in the area of the current price needs to be evaluated.
GM and FORD Short-term Longs
 As I was watching GM, I noted Ford (F) getting very similar signals from my Expert. Waiting until both hit support that warranted the buy signal, I "bought" 1000 paper-shares of both. My Short position in GM is still in play, but I thought I'd take a little profit from what is likely to be a short-term Bullish move to the next ERRC line above the current price. The comparison chart at the left is as of 10/17/2014.
Update: GM and F Longs Closed, Short Study Continues
 |
| Sold both on the Open Friday |
 |
| NEW! UPDATED CHART OF MY GM SHORT POSITION |
With the Start Date (SD) and End Date (ED) for each
of these TW-Channels, you could recreate them
on your own General Motors (GM) chart.
=============================
of these TW-Channels, you could recreate them
on your own General Motors (GM) chart.
 |
| Do you have a chart on which you'd like me to position TW-Channels for you? |
=============================
ARE YOU NEW TO THIS BLOG? WELCOME!!
If you are new to Channel Challenges for Technical Analysts, I welcome you, and would be glad to get to know you and how you found my site. To make the most of what I offer, I suggest you read at least some of my earlier posts to gain a basic understanding of my methods. Of course, reading all my posts, in order, would make sense, but reading those I list below will give you an idea of what has gone before, and provide a good foundation for future learning.
Post 001: "Channel Challenges for Technical Analysts Reborn" introduces me, my methods, and why I began my blog. It mentions the ERRC Color Coder Expert that I initially used in my charts. Unfortunately, over the years, the original version's code was lost as I sought to improve upon it. Its replacement, which is under development, will not only color-code the Over-Bought (OB) and Over-Sold (OS) candles to help place the ERRCs, but also provide various other feedback on the state of the chart. Buy/Sell Signals, Bullish/Bearish Conditions, Volume Greater than Average indications, and even Commentary are my intent. I will make this Expert available for a fee.
Post 004: "How to Draw ERRCs and TeamWork Channels" is a good basic tutorial on how to create TW Channels, beginning with placing an accurate ERRC, following up with placing Standard Error Channels (Std-Err Channels), and/or Standard Deviation Channels (Std-Dev Channels), as needed. Note, I almost never use Std-Dev Channels in my TW-Channels now, unless an obvious support/resistance location is noted in my chart which a Std-Err Channel doesn't "explain".
Post 005: "TeamWork Channels On the Nasdaq 100 Index" gives a good illustration of using TW-Channels on Index charts, in this case the Nasdaq 100 Index. It also provides the Start Dates (SD) and End Dates (ED) of the channels in the chart, so you can reproduce them in your own. It then gives samples of how the TW-Channels, drawn on trends way in the past, chart areas of Support and Resistance in the more current prices, essentially proving their value.
Post 006: "The Fenceline & Overall TW-Channels' Utility" introduces how to draw FenceLine Channels, and Overall TW-Channels, and gives you an idea of why you may wish to include them in your charts.
Post 007: "Why do TW-Channels Work?" answers this question in a rather technical way, but there is a paragraph in the middle that sums up my opinion as to why they work. After re-reading it just now, I realize it could be wording a bit better, so I'll probably expand on it in a future post.
Post 009: "TeamWork Channel Drawbacks" seeks to point out aspects of ERRCs, TW-Channels, etc., that are not, shall we say, optimal? Every indicator I've ever seen has some kind of drawback, including my channels tools. This post gives a good idea of what they are, but also proposes ways that these could be eliminated or at least reduced, with the help of MetaStock's programmers.
Post 011: "WANTED: A TeamWork Channel Tool" is my first effort to propose how a tool could be designed in MetaStock to facilitate and enhance the use of TeamWork Channels. These are effectively the collective form of using ERRCs, Std-Err Channels, Std-Dev Channels, and/or FenceLine Channels, all of which use the same SD and ED for any given TeamWork Channel's parts. Altough my current methods with them work, the tool I describe could take most of the tedium of the task away, and have the added benefit of reducing the level of memory-usage need in MetaStock to produce TeamWork Channels in charts, by eliminating the lines that are not needed in the chart. Since I wrote that post, more ideas on how and why this tool should be built have occurred to me. I will write a post specifically about this issue again in the near future.
===========================================
Topics for Future Discussion
I Just Enrolled in TD AmeriTrade's
thinkorswim
Virtual Trading Program
Why I believe Intraday Traders can benefit
from using TW-Channels in Daily Charts!
Enhancements to My Proposed TW-Channel Tool
===========================================
Wednesday, June 6, 2007
Post 011: WANTED: A TeamWork Channel Tool!
Wouldn't it be nice to have a TeamWork Channel Tool in MetaStock that would make them easy to draw? It certainly would overcome most of the drawbacks of using them.
In conclusion:
I've envisioned this tool, not just because I'd like TeamWork Channels to be easier for me, but so that they'd be easier for everyone. Plus, with this tool available in MetaStock, people who've never read my article or practiced TW-Channels in the tedious way we do now, will have a chance to use it. If MetaStock were modified this way, a lot of my own work would be easier, but it would also allow me to more readily share what I've learned about TW-Channels with the trading public.
JUMP TO MY NEXT POST
================================

INSERTED ANNOUNCEMENT
MID-APRIL 2018
IMPORTANT NOTICE !!!
THINGS ARE FINALLY HAPPENING!!!
I HAVE MET WITH METASTOCK'S MANAGEMENT,
AND HAVE GOTTEN THEIR PROMISE TO HELP ME GET
A PLUG-IN FOR MY TEAMWORK CHANNELS DEVELOPED
STARTING IN MAY. HOW LONG IT MAY TAKE IS UP TO
THE PROGRAMMER'S AND HOW WELL WE INTERACT
TO GET IT DONE. I AM GOING TO STAY ON THEM
UNTIL MY PLUG-IN IS COMPLETED THE WAY
I HAVE IT CURRENTLY ENVISIONED.
I HAVE EDITED OUT THE IMAGES OF
TEAMWORK CHANNEL TOOL,
AS I HAVE A NEW, BETTER TOOL DESIGN!
WATCH MY CURRENT POSTS FOR MORE INFORMATION!!!
In conclusion:
I've envisioned this tool, not just because I'd like TeamWork Channels to be easier for me, but so that they'd be easier for everyone. Plus, with this tool available in MetaStock, people who've never read my article or practiced TW-Channels in the tedious way we do now, will have a chance to use it. If MetaStock were modified this way, a lot of my own work would be easier, but it would also allow me to more readily share what I've learned about TW-Channels with the trading public.
JUMP TO MY NEXT POST
================================
Sunday, May 20, 2007
Post 010: Sorry for delay, technical difficulties!
I apologize for how long it has taken to come back and make a new posting. My old HP with XP on it got messed-up and when I got it back 'corrected' suddenly I could no longer log in to my Blogger editing tools, it would just keep redirected me back in an endless loop. I found that I could access it from any other computer, so now that I have a new system, I'm going to be posting again.
I'm surprised but pleased to note that I have several pretty consistent visitors that have spent a fair amount of time reading my posts. I am grateful to all visitors, but I'd really like to see some posts from you out there.
I'm going to be posting my desires for a TeamWork Channels tool in MetaStock, hopefully tomorrow. See you in my next post. -Robert
JUMP TO MY NEXT POST
=================================
Friday, February 23, 2007
Post 009: TeamWork Channel Drawbacks
 There is no Holy Grail of trading!!!
Every indicator, system, and technical analysis tool out there has some weakness or drawback. Even fundamental analysis has its weaknesses. I will never say that the ERRC and TeamWork Channel are perfect and without drawbacks. If I did, even I wouldn't trust me!
The first, most obvious drawback is... ALL THOSE LINES make a very busy chart. To tell you the truth, when I first began working with TeamWork Channels, some of my teammates actually laughed at my charts. Did it hurt? Well,... the fact that I could put these channels to effective use, even if only for paper-trades, made it easy to ignore them.
Also, as mentioned in an earlier post, each line drawn in the chart adds a bit more workload for the CPU, and it's important for real-time charting to keep this to a minimum. As I've pointed-out before, you would normally reduce the total number of lines down until you only had those needed to surround the current price.
Unfortunately, because the ERRC, the Standard Error Channel, and the Standard Deviation Channel tools are designed to draw an upper- and a lower-line, you're always going to have and upper-band and a lower-band of channel lines, and almost always only of the two bands is doing anything useful. I've often wished there was a way to turn-off either the upper- or lower-line of the channels, to do away with the band that is doing nothing.
Drawing all the Std Err/Dev Channels needed for a TW Channel can be tedious. For now, one has to perservere, focusing on one's faith that the end-result will prove valuable. Creating one channel, and copying and pasting it, then changing the Units value is the best way to do this. There are other tips I can provide later.
If you happen to have some indicator in the chart, near where you are trying to drawn a TW Channel, it may tend to cause the channels to not drawn on the price plot but on the indicator. This is especially true of indicators that are placed in price window using the Overlay Without Scale option, like I do with my Serendipity Indicator.

 On a chart like the one at the left, the thin solid-line of the ERRC is often hard to see amongst all those other lines.
If you have a reason to make it stand-out, you can click on the ERRC line and choose to thicken the line, as shown in the chart on the right. You will find, though, that this will somewhat reduce the precision of the line's ability to chart the Support and Resistance points. I'm sure you'll see what I mean when you try it.
Finally, there is the the drawback of subjectivity. Before I came up with the ERRC, Raff Regression Channels were drawn in many different ways. In fact, I'd bet if you put 10 MetaStock users in a room, and gave them each the same chart to draw Raff Regression Channels on, no two charts would look alike. In fact, I'd be surprised if even one pair of channels between any of the charts shared the exact same dates for the Start Date and End Date.
The use of the Willaims%R indicator to draw the channel was, for me at least, the first step toward reducing the subjectivity of the Raff Regression Channel. The ERRC is a much more accurate and useful tool. It speeds placement, and increases the accuracy of the placement. The addition of my ERRC Color Coder Expert helped reduce subjectivity also. I've seen some charts on web pages that had Raff Regression Channels that not only were not extended to the right, but were willy-nilly drawn on every little switchback tertiary trend in the chart. To me, drawing these channels that way made no sense at all.
Extending the channel lines to the right helps validate/invalidate the channel, because it will show how effectively the lines 'predict' the Support and Resistance points. The parallel lines of a TeamWork Channel will also help validate the channel placement, and reduce subjectivity, by giving even more points for validity-testing.
We will never fully be able to eliminate subjectivity in drawing these channels, but I believe I have some strong and worthwhile ideas on reducing subjectivity to a minimum.
See you in my next post. -Robert
JUMP TO MY NEXT POST
=================================
Subscribe to:
Posts (Atom)